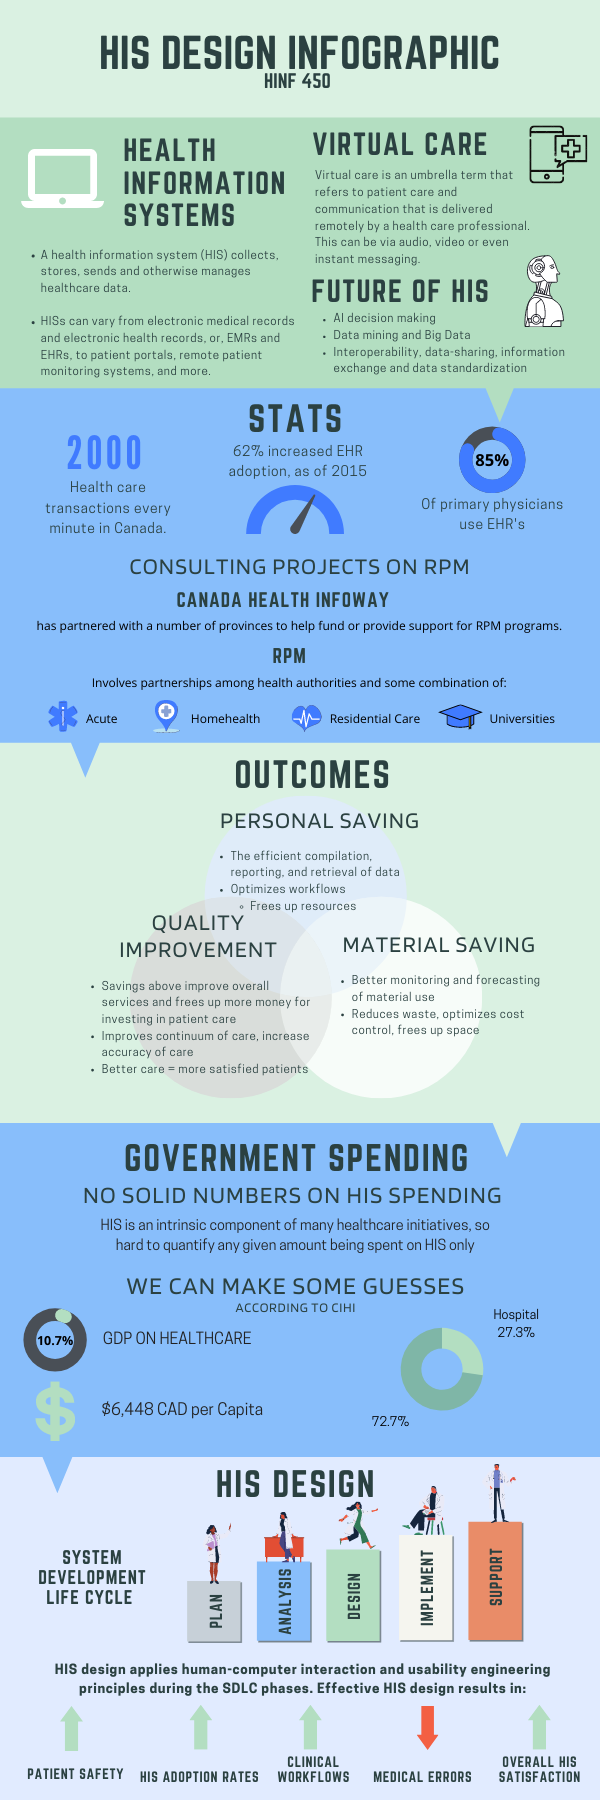
I am going to evaluate my Infographic from a previous senior course I took. To begin, what exactly is an infographic? An infographic is somewhat like a poster. It provides a visual representation of information or data supporting a particular topic (Sheikh, 2021). The goal is to inform individuals in a colourful, captivating, and visually appealing way (Sheikh, 2021). Infographics are a way to provide information in a digestible amount so that it is easier to understand (Sheikh, 2021).
I evaluated the context in which this infographic would be presented (Geuens, 2021). This infographic is better suited in a healthcare setting and the learner would be someone with existing knowledge of healthcare. As someone with experience in healthcare, I had realized that upon further review, some information may not be clear. I clarified the information, resulting in the infographic being now more generalizable to the learner. That means, not just individuals with a healthcare background would gain something from the information. I also wanted the infographic to clearly define the role of the infographic. I eliminated and adjusted information to highlight the main goal (Geuens, 2021). There should be a clear path to an infographic of how one will lay out their information. I wanted information to be simple to more complex. The learner should have a good base prior to receiving more complex information. For that reason, I changed the layout of some of the information as it increased in complexity.
I applied my knowledge from EDCI 337 and began modifying the multimedia object. I applied the cognitive load theory. I began by applying the intrinsic cognitive load theory. I wanted to focus on the core information and material of the multimedia object (“Cognitive load theory.” 2021). I ensured all information presented was clear to the audience. This included removing complex material and keeping the most important aspect. Next, I arranged the material from simple to more complex material as the learner moved along the infographic. I then began the evaluation of the extraneous cognitive load. Extraneous cognitive load is the way the information is presented (“Cognitive load theory.” 2021). I applied the coherence principle and tried to remove any unnecessary designs or figures while still making them appealing and interesting to the eye.
After completing this assignment, I came to the realization that small changes can drastically improve your multimedia object. It is important to consider the context and learners as the main outcome and goal. Focusing on those two elements will help guide how you present your information.
Sheikh, M. (2021, July 23). What is an infographic? (examples, tips and templates). Visme Blog. Retrieved October 31, 2021, from https://visme.co/blog/what-is-an-infographic/.
Geuens, R. (2021, September 6). How to make an infographic in 30 minutes (2021 guide). Piktochart. Retrieved October 31, 2021, from https://piktochart.com/blog/how-to-create-an-infographic-and-other-visual-projects-in-5-minutes/.
Cognitive load theory: Definition, types, and applications for learning [guest post]. Cognition Today. (2021, August 30). Retrieved November 3, 2021, from https://cognitiontoday.com/cognitive-load-theory-definition-types-and-applications-for-learning-guest-post/.
Leave a Reply
You must be logged in to post a comment.